DoughnutANZ
Ka whati te tai ka kai te tōreapango
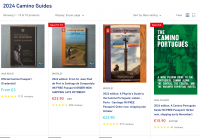
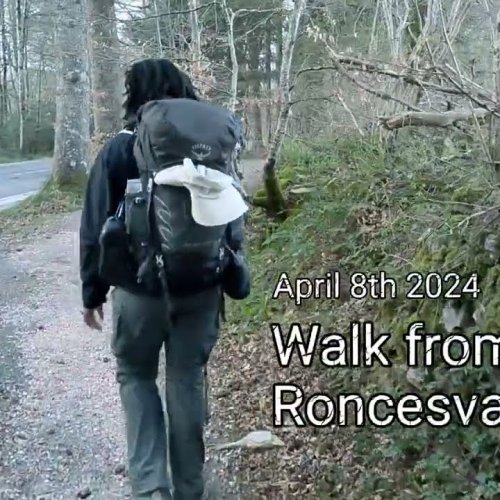
- Time of past OR future Camino
- 2019, 2023, 2024, 2025, 2026, 2027 & 2028.
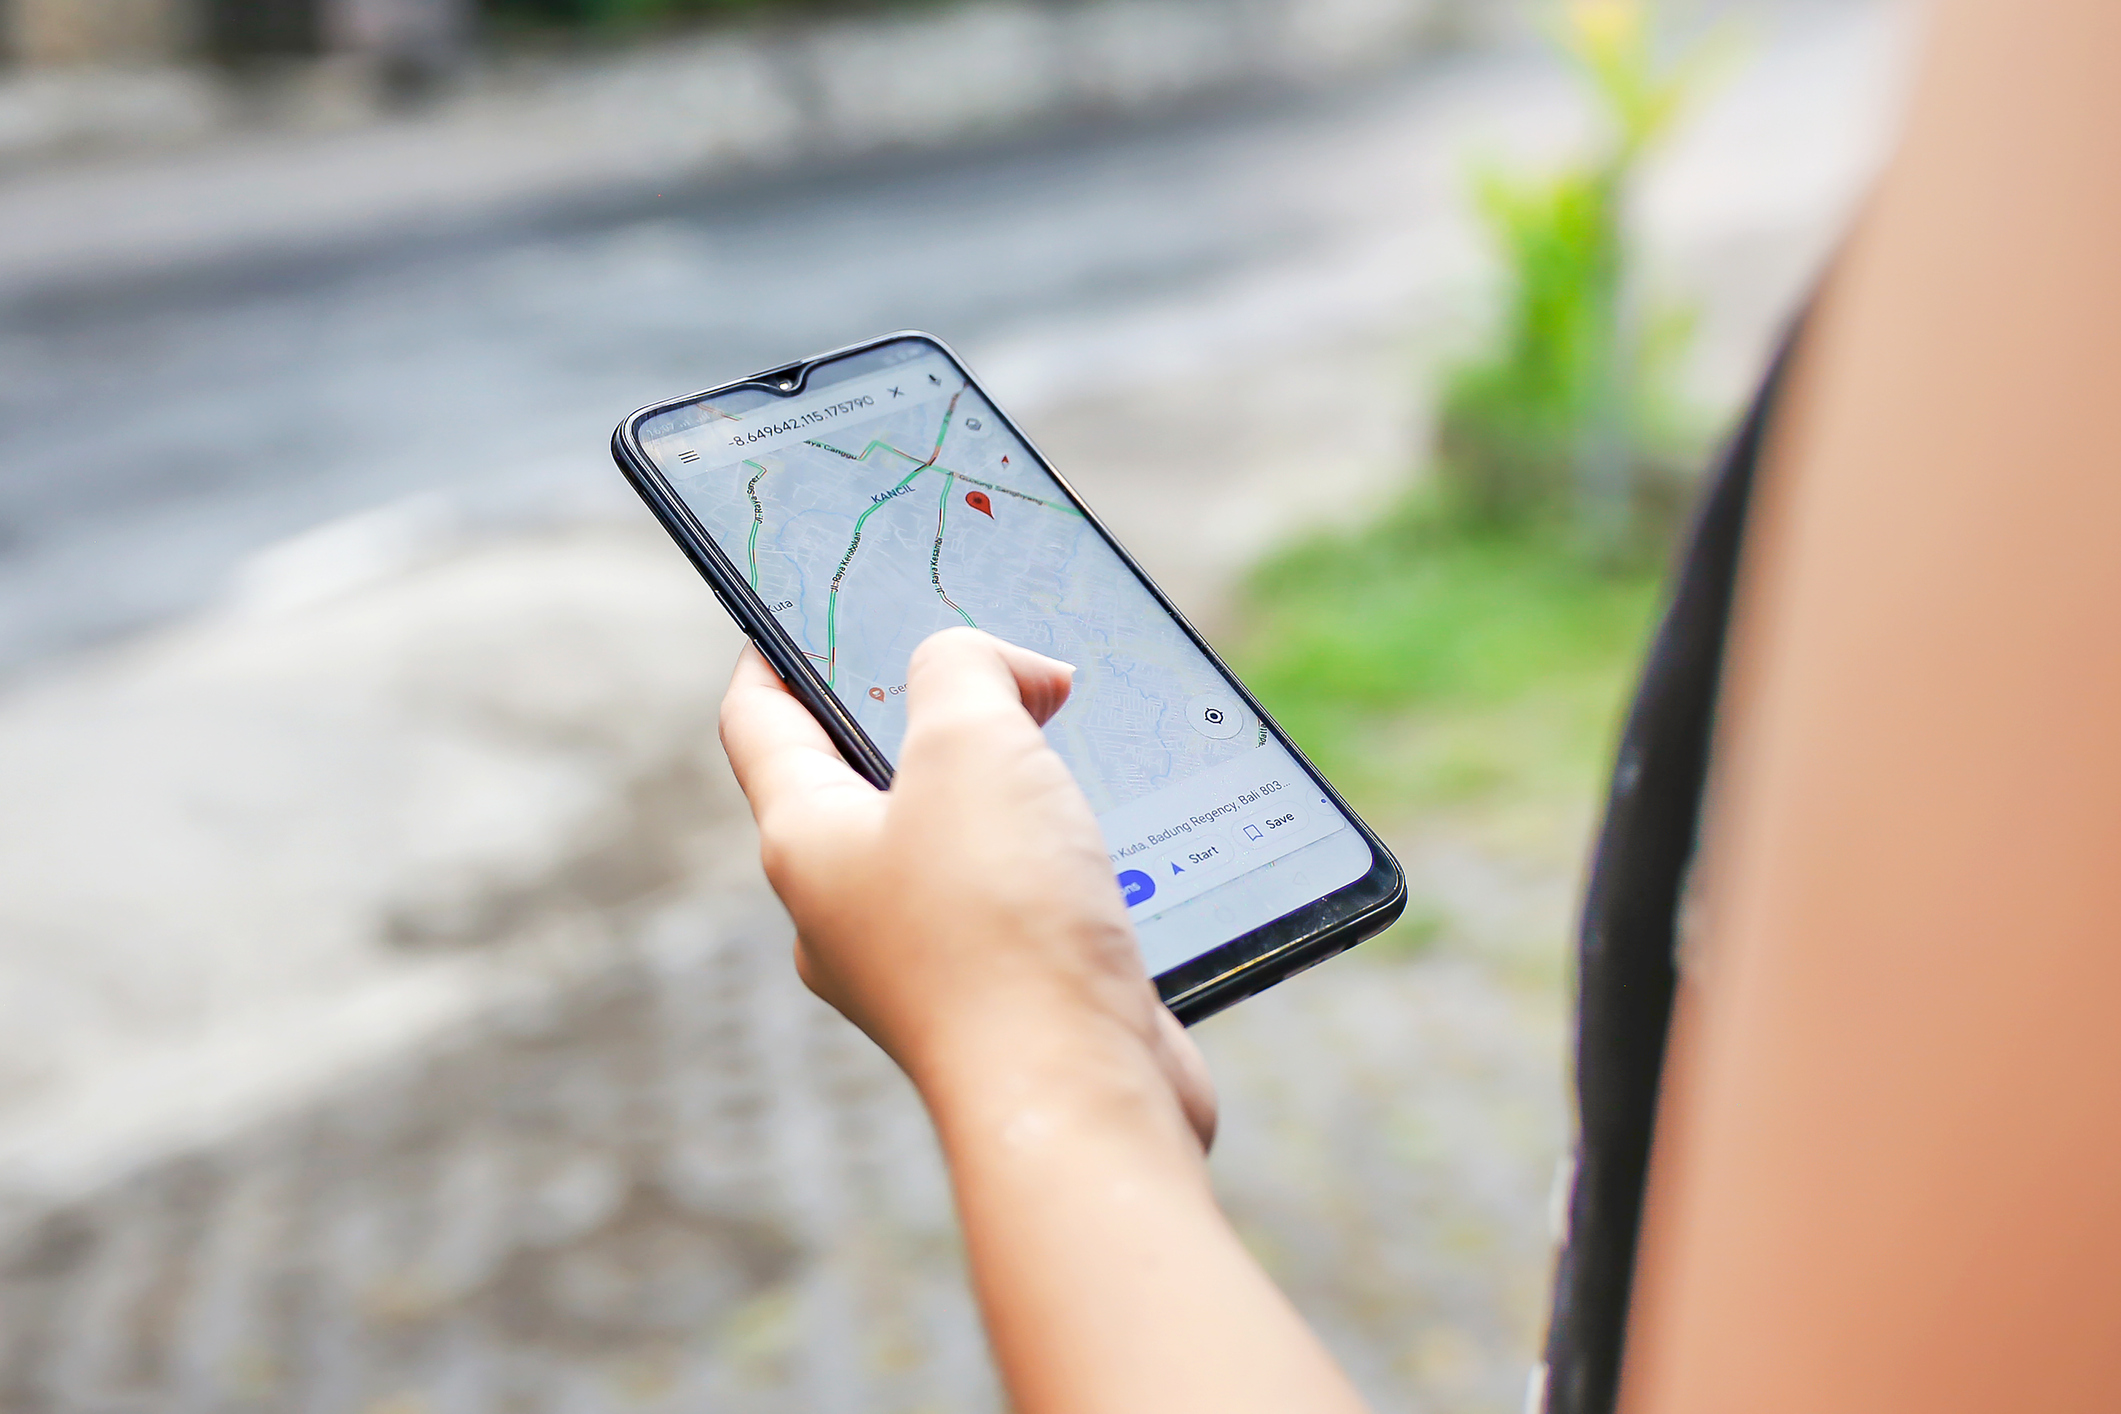
Google has announced that Google Maps can now show a map layer that highlights Covid statistics for various geographic areas.
Google said "When you open Google Maps, tap on the layers button on the top right hand corner of your screen and click on “COVID-19 info”. You’ll then see a seven-day average of new COVID cases per 100,000 people for the area of the map you’re looking at, and a label that indicates whether the cases are trending up or down. Color coding also helps you easily distinguish the density of new cases in an area. Trending case data is visible at the country level for all 220 countries and territories that Google Maps supports, along with state or province, county, and city-level data where available."
For more details, see: https://blog.google/products/maps/navigate-safely-new-covid-data-google-maps/amp/
and
COVID-19 Google Maps updates - Google Maps Help
If your area is affected by COVID-19, you can use Google Maps to obtain relevant information on impacted places. Tip: In some regions, you might find additional information related to COVID-19.
support.google.com


 ...it's been known to happen.